Slide background

Imagine Math different.

Learning List says, “MathImagine is 95% Aligned!”

We begin with the Math Standards and then Build our Math Curriculum 

This helps ensure student learning is targeted to the tasks they’ll be expected to know in their math classes and on state assessments.  Our products are great for everyone…Students, Parents, Teachers, & Administrators

 Find out moreClick to find out more image

MathImagine student achievement state assessments in math

 Math Software product features icon Problem Solving Approach throughout Lessons and Quizzes

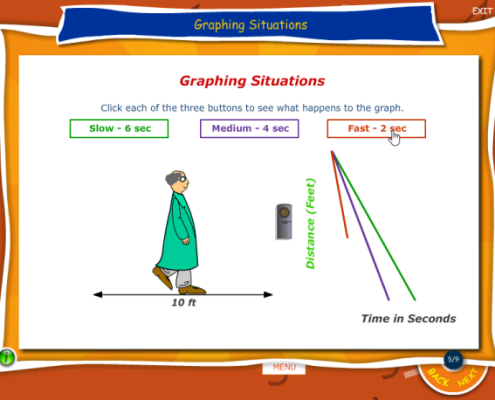
Students learn math concepts through interactive and engaging lessons, always focusing on a problem-solving approach. They’re are also presented with practice questions assessment, targeting each math standard objectives! The quiz items are pulled from a database of thousands of questions.Link to sample Math Lesson and Quiz

  • When they miss a question or respond incorrectly during a lesson, feedback is immediate, animated and thought provoking. 
  • Not just a written textbook explanation of how to solve the problem.  Content is developed to nurture problem solvers, as opposed to students who memorize procedures that are soon forgotten.

Compare MathImagine’sproblem-solving approach with other programs. Experience our student-friendly interactive lessons

Math Software product features icon  Increases Math Vocabulary & Academic Language for ALL Students, Including English Learners and Struggling Students

Students learn the academic language alongside building their math conceptual understanding. Our lessons and quizzes USE the mathematics vocabulary and academic language. Math vocabulary is animated and helps students visualize math vocabulary throughout lessons and quizzes. This is one of many reasons school districts with large populations of English Learners and at-risk students use our program!

 Math Software product features icon 
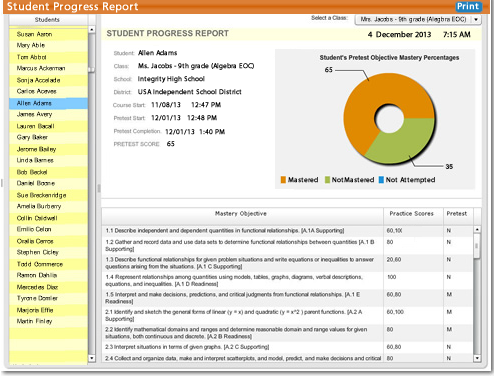
Multi-level Robust Reporting

Districts, Campuses, Teachers, Parents, and Students are able to make in-time instructional decisions, focus learning and make informed decisions that are on target using MathImagine’s™ unique reporting system.

 Math Software product features icon Backed by over 20 Years of Experience in Creating Products for ALL Students

We’re not new to creating programs that create success for ALL students, including English learners and struggling learners. We have the experience and implementation knowledge that goes beyond any other product on the market. MathImagine™ is designed and built by Teachers and Curriculum experts from across the United States using best teaching practices with the whole child in mind. We encourage you to compare our lessons, quizzes, and reports to other programs!

Contact us to get a quote for your online subscription to MathImagine™ from L&M Instructional Services, 210.492.2783, info@lmmath.com.

Try MathImagine Sample Lesson & Quiz

______

Request a Subscription Quote

Learn more about MathImagine with our Whitepaper about student success

Evidence of MathImagine as Designed in Accordance to the Best Practices in Teaching Mathematics

Learn more about us! MathImage Brochure

Guide for Administrators – How to get started today! 

MathImagine Math Software Products to Increase Math Student Achievement

Our math products focus on Math standards and objectives that are assessed! The interactive lessons and problem-based quizzes prepare your students for your state’s assessments and success in their math classes. Whether you’re a student, parent, homeschooler, teacher, or administrator, our products create impact on your understanding of all math concepts! Click on any of the options below to expand the list of Math Standards and Objectives that are targeted in each grade level and course…

Texas Math Products Increase Student Achievement

Texas products are based on the designated grade and course eligible Texas Essential Knowledge and Skills. Click each Math Course below to expand the assessed objectives our lessons and quizzes are built on:

5th Grade STAAR

Numbers, Operations, and Quantitative Reasoning

  • Use Whole Number Place Value to Billions
  • Use Decimal Place Value to Thousandths
  • Generate Equivalent Fractions in Problem Situations
  • Generate Mixed Numbers or Improper Fractions
  • Compare Two Fractional Quantities in Problem Situations
  • Use Models to Relate Decimals to Fractions
  • Add and Subtract Whole Numbers and Decimals
  • Multiply Whole Numbers in Problem Situations
  • Divide Whole Numbers in Problem Situations
  • Identify Common Factors
  • Model Adding and Subtracting Fractions with like Denominators
  • Use Rounding and Compatible Numbers to Estimate Solutions

Patterns, Relationships, and Algebraic Reasoning

  • Describe Relationships between Sets of Data in Graphic Organizers
  • Identify Prime and Composite Numbers using Pictures, Models, and Patterns
  • Select and Use Diagrams and Equations to Represent Situations

Geometry and Spatial Reasoning

  • Identify Essential Attributes of 2 and 3 Dimensional Figures
  • Sketch and Identify the Transformations on a Quadrant I Grid

Concepts and Uses of Measurement

  • Perform Simple Conversions
  • Connect Models to Formula for Perimeter, Area, Volume
  • Select and Use Appropriate Units and Formulas to Measure
  • Solve Problems involving Changes in Temperature
  • Solve Problems involving Elapsed Time

Probability and Statistics

  • Use Fractions to Describe Results of an Experiment
  • Use Experimental Results to make Predictions
  • List all Possible Outcomes of a Probability Experiment
  • Use Tables of Related Number Pairs to Make Line Graphs
  • Describe Characteristics of Data such as Median, Mode and Range
  • Graph Given Data using Appropriate Graphical Representation

6th Grade STAAR

Numbers, Operations, and Quantitative Reasoning

  • Compare and Order Non-Negative Rational Numbers
  • Generate Equivalent Forms of Rational Numbers
  • Use Integers to Represent Real-Life Situations
  • Write Prime Factorizations using Exponents
  • Identify Factors of a Positive Integer, Common Factors and GCFs
  • Identify Multiples of a Positive Integer, Common Multiples and LCMs
  • Model Addition and Subtraction Situations Involving Fractions
  • Use Addition and Subtraction to Solve Problems
  • Use Multiplication and Division of Whole Numbers to Solve Problems
  • Estimate and Round to Approximate Reasonable Results and Solve Problems
  • Use Order of Operations to Simplify Whole Number Expressions

Patterns, Relationships, and Algebraic Reasoning

  • Use Ratios to Describe Proportional Situations
  • Represent Ratios and Percents with Models, Fractions, and Decimals
  • Use Ratios to Make Predictions in Proportional Situations
  • Use Tables and Symbols to Represent Proportional and Other Situations
  • Use Tables of Data to Generate Formulas
  • Formulate Equations from Problem Solving Situations Described by Linear Relationships

Geometry and Spatial Reasoning

  • Use Angle Measurements to Classify Angles
  • Identify Relationships Involving Angles in Triangles and Quadrilaterals
  • Describe the Relationship between Radius, Diameter, and Circumference of a Circle
  • Locate and Name Points on a Coordinate Plane

Concepts and Uses of Measurement

  • Estimate Measurements and Evaluate Reasonableness of Results
  • Select and Use Appropriate Units, Tools, or Formulas to Measure and to Solve Problems
  • Measure Angles
  • Convert Measures within the Same Measurement System

Probability and Statistics

  • Construct Sample Spaces using Lists and Tree Diagrams
  • Find the Probabilities of a Simple Event and Its Complement
  • Select and Use an Appropriate Representation for Presenting and Displaying Different Graphical Representations
  • Identify Mean, Median, Mode and Range of a Set of Data
  • Sketch Circle Graphs to Display Data
  • Solve Problems by Collecting, Organizing, Displaying, and Interpreting Data

7th Grade STAAR

Numbers, Operations, and Quantitative Reasoning

  • Compare and Order Rational Numbers
  • Convert between Fractions, Decimals, Whole Numbers and Percents
  • Represent Squares and Square Roots using Geometric Models
  • Represent Fraction and Decimal Multiplication and Division with Models, Words and Numbers
  • Use Addition, Subtraction, Multiplication and Division to Solve Fraction and Decimal Problems
  • Use Models to Add, Subtract, Multiply and Divide Integers
  • Use Division to Find Unit Rates and Ratios in Proportional Relationships
  • Simplify Numerical Expressions involving Order of Operations and Exponents
  • Select and Use Appropriate Operations to Solve Problems
  • Determine the Reasonableness of a Solution to a Problem

Patterns, Relationships, and Algebraic Reasoning

  • Estimate and Find Solutions to Application Problems involving Percent
  • Estimate and Find Solutions to Application Problems involving Proportional Relationships
  • Generate Formulas involving Unit Conversions, Perimeter, Area, Circumference, Volume and Scaling
  • Graph Data to Demonstrate Relationships in Familiar Concepts
  • Use Words and Symbols to Describe the Relationship between the Terms in an Arithmetic Sequence and their Positions in the Sequence
  • Use Concrete and Pictorial Models to Solve Equations and Use Symbols to Record the Actions
  • Formulate Problem Situations when Given a Simple Equation and Formulate an Equation when given a Problem Situation

Geometry and Spatial Reasoning

  • Use Angle Measurements to Classify Pairs of Angles as Complementary or Supplementary
  • Use Properties to Classify Triangles and Quadrilaterals
  • Use Properties to Classify Three Dimensional Figures
  • Use Critical Attributes to Define Similarity
  • Locate and Name Points on a Coordinate Plane using Ordered Pairs of Integers
  • Graph Reflections Across an Axis and Graph Translations on a Coordinate Plane
  • Sketch Three-Dimensional Figures when Given the Top, Side and Front Views
  • Make a Net of the Surface Area of a Three-Dimensional Figure
  • Use Geometric Concepts and Properties to Solve Problems in Fields such as Art and Architecture

Concepts and Uses of Measurement

  • Estimate Measurements and Solve Application Problems involving Length and Area of Polygons and Other Shapes
  • Connect Models for Volume of Triangular and Rectangular Prisms and Cylinders to Formulas of Triangular and Rectangular Prisms and Cylinders
  • Estimate Measurements and Solve Application Problems involving Volume of Triangular and Rectangular Prisms and Cylinders

Probability and Statistics

  • Construct Sample Spaces for Simple or Composite Events
  • Find the Probability of Independent Events
  • Select and Use an Appropriate Representation for Presenting and Displaying Relationships among Collected Data
  • Make Inferences and Convincing Arguments Based on an Analysis of Given or Collected Data
  • Describe a Set of Data using Mean, Median, Mode and Range
  • Choose among Mean, Median, Mode or Range to Describe a Set of Data and Justify the Choice for a Particular Situation

8th Grade STAAR

Numbers, Operations, and Quantitative Reasoning

  • Compare and Order Rational Numbers
  • Select and Use Appropriate Forms of Rational Numbers to Solve Real-Life Problems
  • Approximate the Value of Irrational Numbers as They Arise from Problem Situations
  • Express Numbers in Scientific Notation, including Negative Exponents, in Appropriate Problem Situations
  • Select Appropriate Operations to Solve Problems involving Rational Numbers
  • Use Appropriate Operations to Solve Problems involving Rational Numbers
  • Evaluate a Solution for Reasonableness
  • Use Multiplication by a Constant Factor (Unit Rate) to Represent Proportional Relationships

Patterns, Relationships, and Algebraic Reasoning

  • Compare and Contrast Proportional and Non-Proportional Linear Relationships
  • Estimate and Find Solutions to Application Problems involving Percents and Other Proportional Relationships
  • Generate a Different Representation of Data Given Another Representation of Data
  • Predict and Find Solutions to Application Problems using Tables, Graphs and Equations
  • Find and Evaluate an Algebraic Expression to Determine Any Term in an Arithmetic Sequence

Geometry and Spatial Reasoning

  • Generate Similar Figures using Dilations including Enlargements and Reductions
  • Graph Dilations, Reflections, and Translations on a Coordinate Plane
  • Draw Three-Dimensional Figures from Different Perspectives
  • Use Geometric Concepts and Properties to Solve Problems in Fields such as Art and Architecture
  • Use Pictures or Models to Demonstrate the Pythagorean Theorem
  • Locate and Name Points on a Coordinate Plane Using Ordered Pairs of Rational Numbers

Measurement

  • Find Lateral and Total Surface Area of Prisms, Pyramids, and Cylinders using Models and Nets
  • Connect Models to Formulas for Volume of Prisms, Cylinders, Pyramids, Spheres and Cones
  • Estimate Measurements and Use Formulas to Solve Application Problems involving Lateral and Total Surface Area and Volume
  • Use the Pythagorean Theorem to Solve Real-Life Problems
  • Use Proportional Relationships in Similar Two-Dimensional Figures or Similar Three-Dimensional figures to Find Missing Measurements
  • Describe the Resulting Effects on Perimeter and Area when Dimensions of a Shape are Changed Proportionally
  • Describe the Resulting Effect on Volume when Dimensions of a Solid are Changed Proportionally

Probability and Statistics

  • Find the Probabilities of Dependent and Independent Events
  • Use Theoretical Probabilities and Experimental Results to Make Predictions and Decisions
  • Select the Appropriate Measure of Central Tendency or Range to Describe a Set of Data and Justify the Choice for a Particular Situation
  • Draw Conclusions and Make Predictions by Analyzing Trends in Scatterplots
  • Select and Use an Appropriate Representation for Presenting and Displaying Relationships among Collected Data
  • Evaluate Methods of Sampling to Determine Validity of an Inference made from a Set of Data
  • Recognize Misuses of Graphical or Numerical Information and Evaluate Predictions and Conclusions based on Data Analysis

Algebra STAAR EOC

Functional Relationships

  • Describe Dependent and Independent Relationships
  • Use Data Sets to Determine Functional Relationships
  • Describe Functional Relationships and Write Equations and Inequalities
  • Represent Relationships using Models, Tables, Graphs, Diagrams, Verbal Descriptions, Equations, and Inequalities
  • Interpret and make Inferences from Functional Relationships

Properties and Attributes of Functions

  • Identify Linear and Quadratic Parent Functions
  • Identify and Determine Reasonableness of Domain and Range Values
  • Interpret Situations in Terms of Graphs
  • Organize Data, Interpret Scatterplots, Model, Predict, and Make Decision
  • Use Symbols to Represent Unknowns and Variables\Look for Patterns and Represent Generalizations Algebraically
  • Find Function Values, Simplify Polynomial Expressions, Solve Equations, and Factor
  • Use Commutative, Associative, Distributive Properties to Simplify Algebraic Expressions

Linear Functions

  • Determine if a Function is Linear
  • Determine Domain and Range of Linear Functions
  • Use Algebraic, Tabular, Graphical, or Verbal Descriptions of Linear Functions
  • Determine Slopes of Linear Functions
  • Interpret the Meaning of Slope and Intercepts
  • Investigate Parameter Changes on the Graph of y = mx + b
  • Write Equations of Lines
  • Determine Intercepts of Linear Functions
  • Predict the Effects of Changing Slope and y-intercept in Applied Situations
  • Relate Direct Variation to Linear Functions

Linear Equations and InequalitiesAnalyze and Formulate Linear Equations and Inequalities

  • Solve Linear Equations and Inequalities using Various Methods
  • Determine Reasonableness of Solutions to Linear Equations and Inequalities
  • Formulate Systems of Linear Equations
  • Solve Systems of Linear Equations using Various Methods
  • Determine Reasonableness of Solutions to Systems of Linear Equations

Quadratic and Other Nonlinear Functions

  • Determine Domain and Range of Quadratic Functions
  • Investigate the Effects of Changes in a on the graph of y = ax² + c
  • Investigate the Effects of Changes in c on the graph of y = ax² + c
  • Analyze Graphs of Quadratic Equations and Draw Conclusions
  • Solve Quadratic Equations using Various Methods
  • Relate the Solutions of Quadratic Equations to the Roots of their Functions
  • Use and Apply the Laws of Exponents
  • Analyze and Represent Situations Involving Inverse Variation
  • Analyze and Represent Situations Involving Exponential Growth and Decay

Geometry STAAR EOC

Geometric Structure

  • Recognize the historical development of geometric systems
  • Compare and contract the structures of Euclidean and non-Euclidean geometries
  • Use constructions to explore attributes of geometric figures and make conjectures about their relationships
  • Make conjectures about angles, lines, polygons, circles, and three-dimensional figures
  • Determine the validity of conditional statement, its converse, inverse, and contrapositive
  • Construct and justify statements about geometric figures and their properties
  • Use logical reasoning to prove statements & find counter examples to disprove statements that are false
  • Use inductive reasoning to formulate a conjecture
  • Use deductive reasoning to prove a statement

Geometric Patterns and Representations

  • Select an appropriate representation to solve problems [concrete, pictorial, graphical, verbal, or symbolic]
  • Use numeric and geometric patterns to develop algebraic expressions
  • Use numeric and geometric patterns to make generalizations about geometric properties
  • Use properties of transformations and their compositions to connect mathematics and the real world
  • Identify and apply patters from right triangles to solve meaningful problems

Dimensionality and the Geometry of Location

  • Describe and draw the intersection of a given plane with various three-dimensional geometric figures
  • Use nets to represent and construct three-dimensional geometric figures
  • Use orthographic and isometric views of three-dimensional geometric figures and solve problems
  • Use one- and two-dimensional coordinate systems to represent points, lines, rays, line segments, and figures
  • Use slopes and equations of lines to investigate geometric relationships
  • Derive and use formulas involving length, slope, and midpoint

Congruence and the Geometry of Size

  • Find areas of regular polygons, circles, and composite figures
  • Find areas of sectors and arc lengths of circles using proportional reasoning
  • Derive, extend, and use the Pythagorean Theorem
  • Find surface areas and volumes of prisms, pyramids, spheres, cones, cylinders, and composites of these figures in problem situations
  • Use area models to connect geometry to probability and statistics
  • Use conversions between measurement systems to solve problems in real-world situations
  • Formulate and test conjectures about properties of:
    • parallel and perpendicular lines and their composite parts
    • polygons and their composite parts and their composite parts
    • circles and the lines that intersect them and their composite parts
  • Analyze the characteristics of polyhedra and other three-dimensional figures and their composite parts
  • Use congruence transformations to make conjectures and justify properties of geometric figures
  • Justify and apply triangle congruence relationships

Similarity and the Geometry of Shape

  • Use and extend similarity properties and transformations
  • Use ratios to solve problems involving similar figures
  • Develop, apply, and justify triangle similarity relationships [right triangle & trigonometric ratios, and Pythagorean triples]
  • Describe the effect on perimeter, area, and volume when one or more dimensions of a figure are changed and apply it to solving problems

Algebra II STAAR EOC

Under Development – coming soon

Our National Products are built on the standards and objectives for Grades 5 through the courses Algebra 1 & Geometry. Click on each grade level to preview the Standards and Objectives that are the focus for the objectives our lessons and extensive database of assessment items they’re built on:

5th Grade

Numbers, Operations, and Quantitative Reasoning

  • Use Whole Number Place Value to Billions
  • Use Decimal Place Value to Thousandths
  • Generate Equivalent Fractions in Problem Situations
  • Generate Mixed Numbers or Improper Fractions
  • Compare Two Fractional Quantities in Problem Situations
  • Use Models to Relate Decimals to Fractions
  • Add and Subtract Whole Numbers and Decimals
  • Multiply Whole Numbers in Problem Situations
  • Divide Whole Numbers in Problem Situations
  • Identify Common Factors
  • Model Adding and Subtracting Fractions with like Denominators
  • Use Rounding and Compatible Numbers to Estimate Solutions

Patterns, Relationships, and Algebraic Reasoning

  • Describe Relationships between Sets of Data in Graphic Organizers
  • Identify Prime and Composite Numbers using Pictures, Models, and Patterns
  • Select and Use Diagrams and Equations to Represent Situations

Geometry and Spatial Reasoning

  • Identify Essential Attributes of 2 and 3 Dimensional Figures
  • Sketch and Identify the Transformations on a Quadrant I Grid

Concepts and Uses of Measurement

  • Perform Simple Conversions
  • Connect Models to Formula for Perimeter, Area, Volume
  • Select and Use Appropriate Units and Formulas to Measure
  • Solve Problems involving Changes in Temperature
  • Solve Problems involving Elapsed Time

Probability and Statistics

  • Use Fractions to Describe Results of an Experiment
  • Use Experimental Results to make Predictions
  • List all Possible Outcomes of a Probability Experiment
  • Use Tables of Related Number Pairs to Make Line Graphs
  • Describe Characteristics of Data such as Median, Mode and Range
  • Graph Given Data using Appropriate Graphical Representation

6th Grade

Numbers, Operations, and Quantitative Reasoning

  • Compare and Order Non-Negative Rational Numbers
  • Generate Equivalent Forms of Rational Numbers
  • Use Integers to Represent Real-Life Situations
  • Write Prime Factorizations using Exponents
  • Identify Factors of a Positive Integer, Common Factors and GCFs
  • Identify Multiples of a Positive Integer, Common Multiples and LCMs
  • Model Addition and Subtraction Situations Involving Fractions
  • Use Addition and Subtraction to Solve Problems
  • Use Multiplication and Division of Whole Numbers to Solve Problems
  • Estimate and Round to Approximate Reasonable Results and Solve Problems
  • Use Order of Operations to Simplify Whole Number Expressions

Patterns, Relationships, and Algebraic Reasoning

  • Use Ratios to Describe Proportional Situations
  • Represent Ratios and Percents with Models, Fractions, and Decimals
  • Use Ratios to Make Predictions in Proportional Situations
  • Use Tables and Symbols to Represent Proportional and Other Situations
  • Use Tables of Data to Generate Formulas
  • Formulate Equations from Problem Solving Situations Described by Linear Relationships

Geometry and Spatial Reasoning

  • Use Angle Measurements to Classify Angles
  • Identify Relationships Involving Angles in Triangles and Quadrilaterals
  • Describe the Relationship between Radius, Diameter, and Circumference of a Circle
  • Locate and Name Points on a Coordinate Plane

Concepts and Uses of Measurement

  • Estimate Measurements and Evaluate Reasonableness of Results
  • Select and Use Appropriate Units, Tools, or Formulas to Measure and to Solve Problems
  • Measure Angles
  • Convert Measures within the Same Measurement System

Probability and Statistics

  • Construct Sample Spaces using Lists and Tree Diagrams
  • Find the Probabilities of a Simple Event and Its Complement
  • Select and Use an Appropriate Representation for Presenting and Displaying Different Graphical Representations
  • Identify Mean, Median, Mode and Range of a Set of Data
  • Sketch Circle Graphs to Display Data
  • Solve Problems by Collecting, Organizing, Displaying, and Interpreting Data

7th Grade

Numbers, Operations, and Quantitative Reasoning

  • Compare and Order Rational Numbers
  • Convert between Fractions, Decimals, Whole Numbers and Percents
  • Represent Squares and Square Roots using Geometric Models
  • Represent Fraction and Decimal Multiplication and Division with Models, Words and Numbers
  • Use Addition, Subtraction, Multiplication and Division to Solve Fraction and Decimal Problems
  • Use Models to Add, Subtract, Multiply and Divide Integers
  • Use Division to Find Unit Rates and Ratios in Proportional Relationships
  • Simplify Numerical Expressions involving Order of Operations and Exponents
  • Select and Use Appropriate Operations to Solve Problems
  • Determine the Reasonableness of a Solution to a Problem

Patterns, Relationships, and Algebraic Reasoning

  • Estimate and Find Solutions to Application Problems involving Percent
  • Estimate and Find Solutions to Application Problems involving Proportional Relationships
  • Generate Formulas involving Unit Conversions, Perimeter, Area, Circumference, Volume and Scaling
  • Graph Data to Demonstrate Relationships in Familiar Concepts
  • Use Words and Symbols to Describe the Relationship between the Terms in an Arithmetic Sequence and their Positions in the Sequence
  • Use Concrete and Pictorial Models to Solve Equations and Use Symbols to Record the Actions
  • Formulate Problem Situations when Given a Simple Equation and Formulate an Equation when given a Problem Situation

Geometry and Spatial Reasoning

  • Use Angle Measurements to Classify Pairs of Angles as Complementary or Supplementary
  • Use Properties to Classify Triangles and Quadrilaterals
  • Use Properties to Classify Three Dimensional Figures
  • Use Critical Attributes to Define Similarity
  • Locate and Name Points on a Coordinate Plane using Ordered Pairs of Integers
  • Graph Reflections Across an Axis and Graph Translations on a Coordinate Plane
  • Sketch Three-Dimensional Figures when Given the Top, Side and Front Views
  • Make a Net of the Surface Area of a Three-Dimensional Figure
  • Use Geometric Concepts and Properties to Solve Problems in Fields such as Art and Architecture

Concepts and Uses of Measurement

  • Estimate Measurements and Solve Application Problems involving Length and Area of Polygons and Other Shapes
  • Connect Models for Volume of Triangular and Rectangular Prisms and Cylinders to Formulas of Triangular and Rectangular Prisms and Cylinders
  • Estimate Measurements and Solve Application Problems involving Volume of Triangular and Rectangular Prisms and Cylinders

Probability and Statistics

  • Construct Sample Spaces for Simple or Composite Events
  • Find the Probability of Independent Events
  • Select and Use an Appropriate Representation for Presenting and Displaying Relationships among Collected Data
  • Make Inferences and Convincing Arguments Based on an Analysis of Given or Collected Data
  • Describe a Set of Data using Mean, Median, Mode and Range
  • Choose among Mean, Median, Mode or Range to Describe a Set of Data and Justify the Choice for a Particular Situation

8th Grade

Numbers, Operations, and Quantitative Reasoning

  • Compare and Order Rational Numbers
  • Select and Use Appropriate Forms of Rational Numbers to Solve Real-Life Problems
  • Approximate the Value of Irrational Numbers as They Arise from Problem Situations
  • Express Numbers in Scientific Notation, including Negative Exponents, in Appropriate Problem Situations
  • Select Appropriate Operations to Solve Problems involving Rational Numbers
  • Use Appropriate Operations to Solve Problems involving Rational Numbers
  • Evaluate a Solution for Reasonableness
  • Use Multiplication by a Constant Factor (Unit Rate) to Represent Proportional Relationships

Patterns, Relationships, and Algebraic Reasoning

  • Compare and Contrast Proportional and Non-Proportional Linear Relationships
  • Estimate and Find Solutions to Application Problems involving Percents and Other Proportional Relationships
  • Generate a Different Representation of Data Given Another Representation of Data
  • Predict and Find Solutions to Application Problems using Tables, Graphs and Equations
  • Find and Evaluate an Algebraic Expression to Determine Any Term in an Arithmetic Sequence

Geometry and Spatial Reasoning

  • Generate Similar Figures using Dilations including Enlargements and Reductions
  • Graph Dilations, Reflections, and Translations on a Coordinate Plane
  • Draw Three-Dimensional Figures from Different Perspectives
  • Use Geometric Concepts and Properties to Solve Problems in Fields such as Art and Architecture
  • Use Pictures or Models to Demonstrate the Pythagorean Theorem
  • Locate and Name Points on a Coordinate Plane Using Ordered Pairs of Rational Numbers

Measurement

  • Find Lateral and Total Surface Area of Prisms, Pyramids, and Cylinders using Models and Nets
  • Connect Models to Formulas for Volume of Prisms, Cylinders, Pyramids, Spheres and Cones
  • Estimate Measurements and Use Formulas to Solve Application Problems involving Lateral and Total Surface Area and Volume
  • Use the Pythagorean Theorem to Solve Real-Life Problems
  • Use Proportional Relationships in Similar Two-Dimensional Figures or Similar Three-Dimensional figures to Find Missing Measurements
  • Describe the Resulting Effects on Perimeter and Area when Dimensions of a Shape are Changed Proportionally
  • Describe the Resulting Effect on Volume when Dimensions of a Solid are Changed Proportionally

Probability and Statistics

  • Find the Probabilities of Dependent and Independent Events
  • Use Theoretical Probabilities and Experimental Results to Make Predictions and Decisions
  • Select the Appropriate Measure of Central Tendency or Range to Describe a Set of Data and Justify the Choice for a Particular Situation
  • Draw Conclusions and Make Predictions by Analyzing Trends in Scatterplots
  • Select and Use an Appropriate Representation for Presenting and Displaying Relationships among Collected Data
  • Evaluate Methods of Sampling to Determine Validity of an Inference made from a Set of Data
  • Recognize Misuses of Graphical or Numerical Information and Evaluate Predictions and Conclusions based on Data Analysis

Algebra 1

Functional Relationships

  • Describe Dependent and Independent Relationships
  • Use Data Sets to Determine Functional Relationships
  • Describe Functional Relationships and Write Equations and Inequalities
  • Represent Relationships using Models, Tables, Graphs, Diagrams, Verbal Descriptions, Equations, and Inequalities
  • Interpret and make Inferences from Functional Relationships

Properties and Attributes of Functions

  • Identify Linear and Quadratic Parent Functions
  • Identify and Determine Reasonableness of Domain and Range Values
  • Interpret Situations in Terms of Graphs
  • Organize Data, Interpret Scatterplots, Model, Predict, and Make Decision
  • Use Symbols to Represent Unknowns and Variables\Look for Patterns and Represent Generalizations Algebraically
  • Find Function Values, Simplify Polynomial Expressions, Solve Equations, and Factor
  • Use Commutative, Associative, Distributive Properties to Simplify Algebraic Expressions

Linear Functions

  • Determine if a Function is Linear
  • Determine Domain and Range of Linear Functions
  • Use Algebraic, Tabular, Graphical, or Verbal Descriptions of Linear Functions
  • Determine Slopes of Linear Functions
  • Interpret the Meaning of Slope and Intercepts
  • Investigate Parameter Changes on the Graph of y = mx + b
  • Write Equations of Lines
  • Determine Intercepts of Linear Functions
  • Predict the Effects of Changing Slope and y-intercept in Applied Situations
  • Relate Direct Variation to Linear Functions

Linear Equations and InequalitiesAnalyze and Formulate Linear Equations and Inequalities

  • Solve Linear Equations and Inequalities using Various Methods
  • Determine Reasonableness of Solutions to Linear Equations and Inequalities
  • Formulate Systems of Linear Equations
  • Solve Systems of Linear Equations using Various Methods
  • Determine Reasonableness of Solutions to Systems of Linear Equations

Quadratic and Other Nonlinear Functions

  • Determine Domain and Range of Quadratic Functions
  • Investigate the Effects of Changes in a on the graph of y = ax² + c
  • Investigate the Effects of Changes in c on the graph of y = ax² + c
  • Analyze Graphs of Quadratic Equations and Draw Conclusions
  • Solve Quadratic Equations using Various Methods
  • Relate the Solutions of Quadratic Equations to the Roots of their Functions
  • Use and Apply the Laws of Exponents
  • Analyze and Represent Situations Involving Inverse Variation
  • Analyze and Represent Situations Involving Exponential Growth and Decay

Geometry

Geometric Structure

  • Recognize the historical development of geometric systems
  • Compare and contract the structures of Euclidean and non-Euclidean geometries
  • Use constructions to explore attributes of geometric figures and make conjectures about their relationships
  • Make conjectures about angles, lines, polygons, circles, and three-dimensional figures
  • Determine the validity of conditional statement, its converse, inverse, and contrapositive
  • Construct and justify statements about geometric figures and their properties
  • Use logical reasoning to prove statements & find counter examples to disprove statements that are false
  • Use inductive reasoning to formulate a conjecture
  • Use deductive reasoning to prove a statement

Geometric Patterns and Representations

  • Select an appropriate representation to solve problems [concrete, pictorial, graphical, verbal, or symbolic]
  • Use numeric and geometric patterns to develop algebraic expressions
  • Use numeric and geometric patterns to make generalizations about geometric properties
  • Use properties of transformations and their compositions to connect mathematics and the real world
  • Identify and apply patters from right triangles to solve meaningful problems

Dimensionality and the Geometry of Location

  • Describe and draw the intersection of a given plane with various three-dimensional geometric figures
  • Use nets to represent and construct three-dimensional geometric figures
  • Use orthographic and isometric views of three-dimensional geometric figures and solve problems
  • Use one- and two-dimensional coordinate systems to represent points, lines, rays, line segments, and figures
  • Use slopes and equations of lines to investigate geometric relationships
  • Derive and use formulas involving length, slope, and midpoint

Congruence and the Geometry of Size

  • Find areas of regular polygons, circles, and composite figures
  • Find areas of sectors and arc lengths of circles using proportional reasoning
  • Derive, extend, and use the Pythagorean Theorem
  • Find surface areas and volumes of prisms, pyramids, spheres, cones, cylinders, and composites of these figures in problem situations
  • Use area models to connect geometry to probability and statistics
  • Use conversions between measurement systems to solve problems in real-world situations
  • Formulate and test conjectures about properties of:
    • parallel and perpendicular lines and their composite parts
    • polygons and their composite parts and their composite parts
    • circles and the lines that intersect them and their composite parts
  • Analyze the characteristics of polyhedra and other three-dimensional figures and their composite parts
  • Use congruence transformations to make conjectures and justify properties of geometric figures
  • Justify and apply triangle congruence relationships

Similarity and the Geometry of Shape

  • Use and extend similarity properties and transformations
  • Use ratios to solve problems involving similar figures
  • Develop, apply, and justify triangle similarity relationships [right triangle & trigonometric ratios, and Pythagorean triples]
  • Describe the effect on perimeter, area, and volume when one or more dimensions of a figure are changed and apply it to solving problems
Math software for student achievement on New York math assessments tests

New York’s Integrated Algebra Regents State Exam is built the New York State Standards and objectives in Mathematics. Click on the Integrated Algebra Regents State Exam below to expand the objectives our lessons and extensive database of assessment items they’re built on:

Regents Integrated Algebra

Number Sense and Operations

  • Apply Properties of Real Numbers
  • Simplify and Perform Operations on Radicals
  • Convert Standard Notation to and from Scientific Notation
  • Describe and Solve Problems Involving Fractions, Decimals, Percents and Proportionality
  • Evaluate Expressions

Algebra – Foundations of Functions

  • Describe Dependent and Independent Relationships
  • Use Data Sets to Determine Functional Relationships
  • Describe Functional Relationships and Write Equations and Inequalities
  • Represent Relationships using Models, Tables, Graphs, Diagrams, Verbal Descriptions, Equations and Inequalities
  • Interpret and make Inferences from Functional Relationships
  • Identify Graphs of Linear, Quadratic, Absolute Value and Exponential Functions

Algebra – Properties and Attributes of Functions

  • Interpret Situations in Terms of Graphs
  • Organize Data, Interpret Scatterplots, Model, Predict and Make Decisions
  • Use Symbols to Represent Unknowns and Variables
  • Look for Patterns and Represent Generalizations Algebraically
  • Find Function Values, Simplify Polynomial Expressions, Solve Equations and Factor
  • Use Commutative, Associative, Distributive Properties to Simplify Expressions
  • Apply operations and simplify Rational Expressions and Equations
  • Use Set-Builder and Interval Notation

Algebra – Linear Functions

  • Determine if a Function is Linear
  • Use Algebraic, Tabular, Graphical, or Verbal Descriptions of Linear Functions
  • Determine the Meaning of Slopes and Intercepts
  • Investigate Parameter Changes on the Graph of y = mx + b
  • Write Equations of Lines
  • Identify and define the Intercepts of Linear Functions
  • Predict the Effects of Changing Slope and y-intercept in Applied Situations
  • Relate Direct Variation to Linear Functions

Algebra – Linear Equations, Inequalities and Systems of Equations

  • Analyze and Formulate Linear Equations and Inequalities
  • Solve Linear Equations and Inequalities using Various Methods
  • Determine the Reasonableness of Solutions to Linear Equations and Inequalities
  • Formulate Systems of Linear Equations
  • Solve Systems of Linear Equations using Various Methods

Algebra – Quadratic and Other Nonlinear Functions

  • Investigate the Effects of Changes in a on the graph of y = ax2 + c
  • Investigate the Effects of Changes in  on the graph of y = ax2 + c
  • Analyze Graphs of Quadratic Equations and Draw Conclusions
  • Solve Quadratic Equations using Various Methods
  • Relate the Solutions of Quadratic Equations to the Roots of their Functions
  • Find the Vertex and Axis of Symmetry of a Parabola
  • Solve Problems involving Exponential Growth and Decay

Geometry and Measurement

  • Find Areas of Polygons and Composite Functions
  • Find Areas of Sectors and Arc Lengths of Circles
  • Use Slope and Equations of Lines to Investigate Parallel and Perpendicular Lines in Polygons
  • Solve Problems including Special Right Triangles and Triangles whose sides are Pythagorean Triple
  • Solve Problems using Right Triangle Trigonometry
  • Use formulas to Calculate Volume and Surface Area of Rectangular Solids and Cylinders
  • Probability and Statistics
  • Determine the Number of Possible Events
  • Determine the Number of Possible Arrangements
  • Find the Probabilities of Compound Events
  • Use Theoretical Probabilities and Experimental Results to Make Predictions
  • Select the Appropriate Measure of Central Tendency to Describe a Set of Data
  • Construct Circle Graphs, Bar Graphs and Histograms

Mathematical Processes and Tools – Problem Solving

MathImagine math online software for meeting math standards

MathImagine™ Galleries

Click on any of the galleries to the right to see how our design and experience make us different… in a good way.